Observability
How to see what your agents are doing: what they cost, what’s running, why a process exists, and how to ship it all to Grafana Cloud.
| Tool | Answers | Surface |
|---|---|---|
| Usage analytics (burndown) | “What am I spending: by day, project, model?” | i in the TUI · ainb burndown |
| abtop | ”What agent processes are running right now?” | t in the TUI · ainb abtop |
| witr | ”Why is this process running: what spawned it?” | w in the TUI · ainb witr |
| OpenTelemetry → Grafana Cloud | ”Ship metrics/logs/traces off-box to dashboards” | ainb otel setup |
Local vs remote
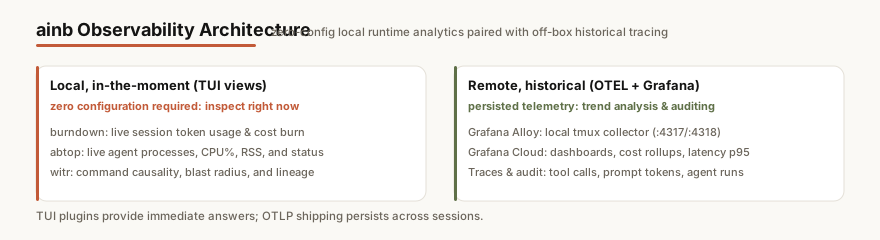
The first three are local, in-the-moment views: open them in the TUI and read the answer now, no setup. OpenTelemetry is the off-box, historical path: a local Grafana Alloy collector forwards Claude Code / Codex telemetry to Grafana Cloud for cost dashboards, latency percentiles, and trace retention.
Start with the OpenTelemetry guide for the Grafana Cloud setup and example dashboards.