OpenTelemetry → Grafana Cloud
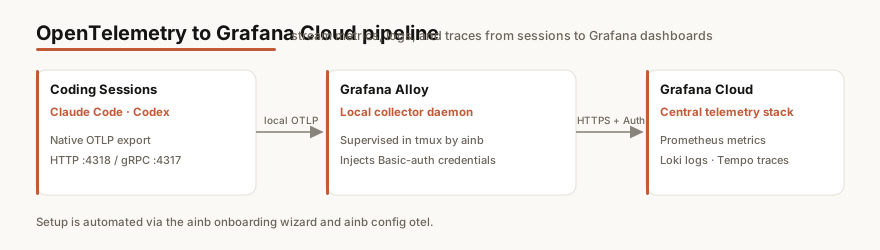
Ship Claude Code (and Codex) metrics, logs, and traces to Grafana Cloud via a
local Grafana Alloy collector. Wired into
both the ainb CLI and the first-run TUI onboarding wizard.
What you need
| Thing | Why | How to get it |
|---|---|---|
| Grafana Cloud account | Destination for telemetry | Free tier at grafana.com |
| OTLP endpoint URL | Where Alloy ships data | Grafana Cloud → Connections → OpenTelemetry (OTLP) (ends in /otlp) |
| Instance ID | Basic-auth username | Same OTLP page (“Instance ID”) |
| API token | Basic-auth password | Same page → generate a token with metrics + logs + traces write scope |
alloy binary | The local collector | brew install grafana/grafana/alloy (the CLI offers to install it) |
The three Grafana values come from one screen: Connections → OpenTelemetry (OTLP) in your Grafana Cloud stack. The “Instance ID” there is the Basic-auth username: it is NOT your org id.
Example of the three values (yours differ by region/stack):
OTLP endpoint https://otlp-gateway-prod-us-east-0.grafana.net/otlpInstance ID 1234567API token glc_eyJ... (scope: metrics + logs + traces write)The OTLP endpoint is the remote Grafana Cloud URL Alloy ships to (ends in
/otlp): not the localhttp://localhost:4318that Claude Code points at. That local hop is wired automatically; you only supply the remote endpoint here.
Setup (CLI)
ainb otel setup # interactive, full-autoainb otel status # check the local pipelineainb otel start # (re)start Alloy in its tmux sessionainb otel setup will:
- Write the Alloy config + launcher + dashboards to
~/.agents-in-a-box/otel/. - Prompt for the three Grafana Cloud values (or read them from
GRAFANA_OTLP_ENDPOINT/GRAFANA_INSTANCE_ID/GRAFANA_API_TOKENenv vars if set). - Write
~/.agents-in-a-box/otel/grafana-cloud.env(mode0600: secrets). - Ensure the generic, non-secret OTEL keys are in
~/.claude/settings.json. - Wire your shell rc to
sourcethe env file (backed up to<rc>.bak). - Offer to
brew installAlloy if missing, then start it in tmux.
Setup (TUI)
The onboarding wizard has an optional Telemetry step. Fill the three fields
(Tab to move between them) and press Enter to set up, or press Enter with the
fields empty to skip. Re-run later any time with ainb otel setup.
The TUI does not brew install Alloy: if it’s missing the config is still
written; finish with ainb otel setup or brew install grafana/grafana/alloy
then ainb otel start.
Where things live (and why)
| File | Contents | Secret? |
|---|---|---|
~/.claude/settings.json (env) | Generic OTEL flags (exporter/protocol/intervals/log toggles) | No: this file syncs to a public repo, so nothing machine-specific or secret goes here |
~/.agents-in-a-box/otel/grafana-cloud.env | OTEL_EXPORTER_OTLP_ENDPOINT, OTEL_RESOURCE_ATTRIBUTES (host.name), GRAFANA_* creds | Yes: 0600, never committed, sourced by your shell + read by Alloy |
~/.agents-in-a-box/otel/config.alloy | Alloy OTLP fan-in pipeline (Delta→Cumulative for Mimir) | No |
~/.agents-in-a-box/otel/dashboards/*.json | Grafana dashboards to import (Claude Code + Codex) | No |
Shell env wins over the settings.json env block, so the machine-specific
values in grafana-cloud.env are authoritative per machine.
Verify
ainb otel status # env file / config / alloy install + tmux sessionainb doctor # alloy shows under the "otel" consumer groupAlloy’s local UI/health is at http://127.0.0.1:12345. Import the dashboards
under ~/.agents-in-a-box/otel/dashboards/ into your Grafana Cloud stack to see
the data.
Dashboards (what you get)
ainb otel setup writes ready-to-import dashboards to
~/.agents-in-a-box/otel/dashboards/. Import them in Grafana Cloud
(Dashboards → New → Import) to land these views.
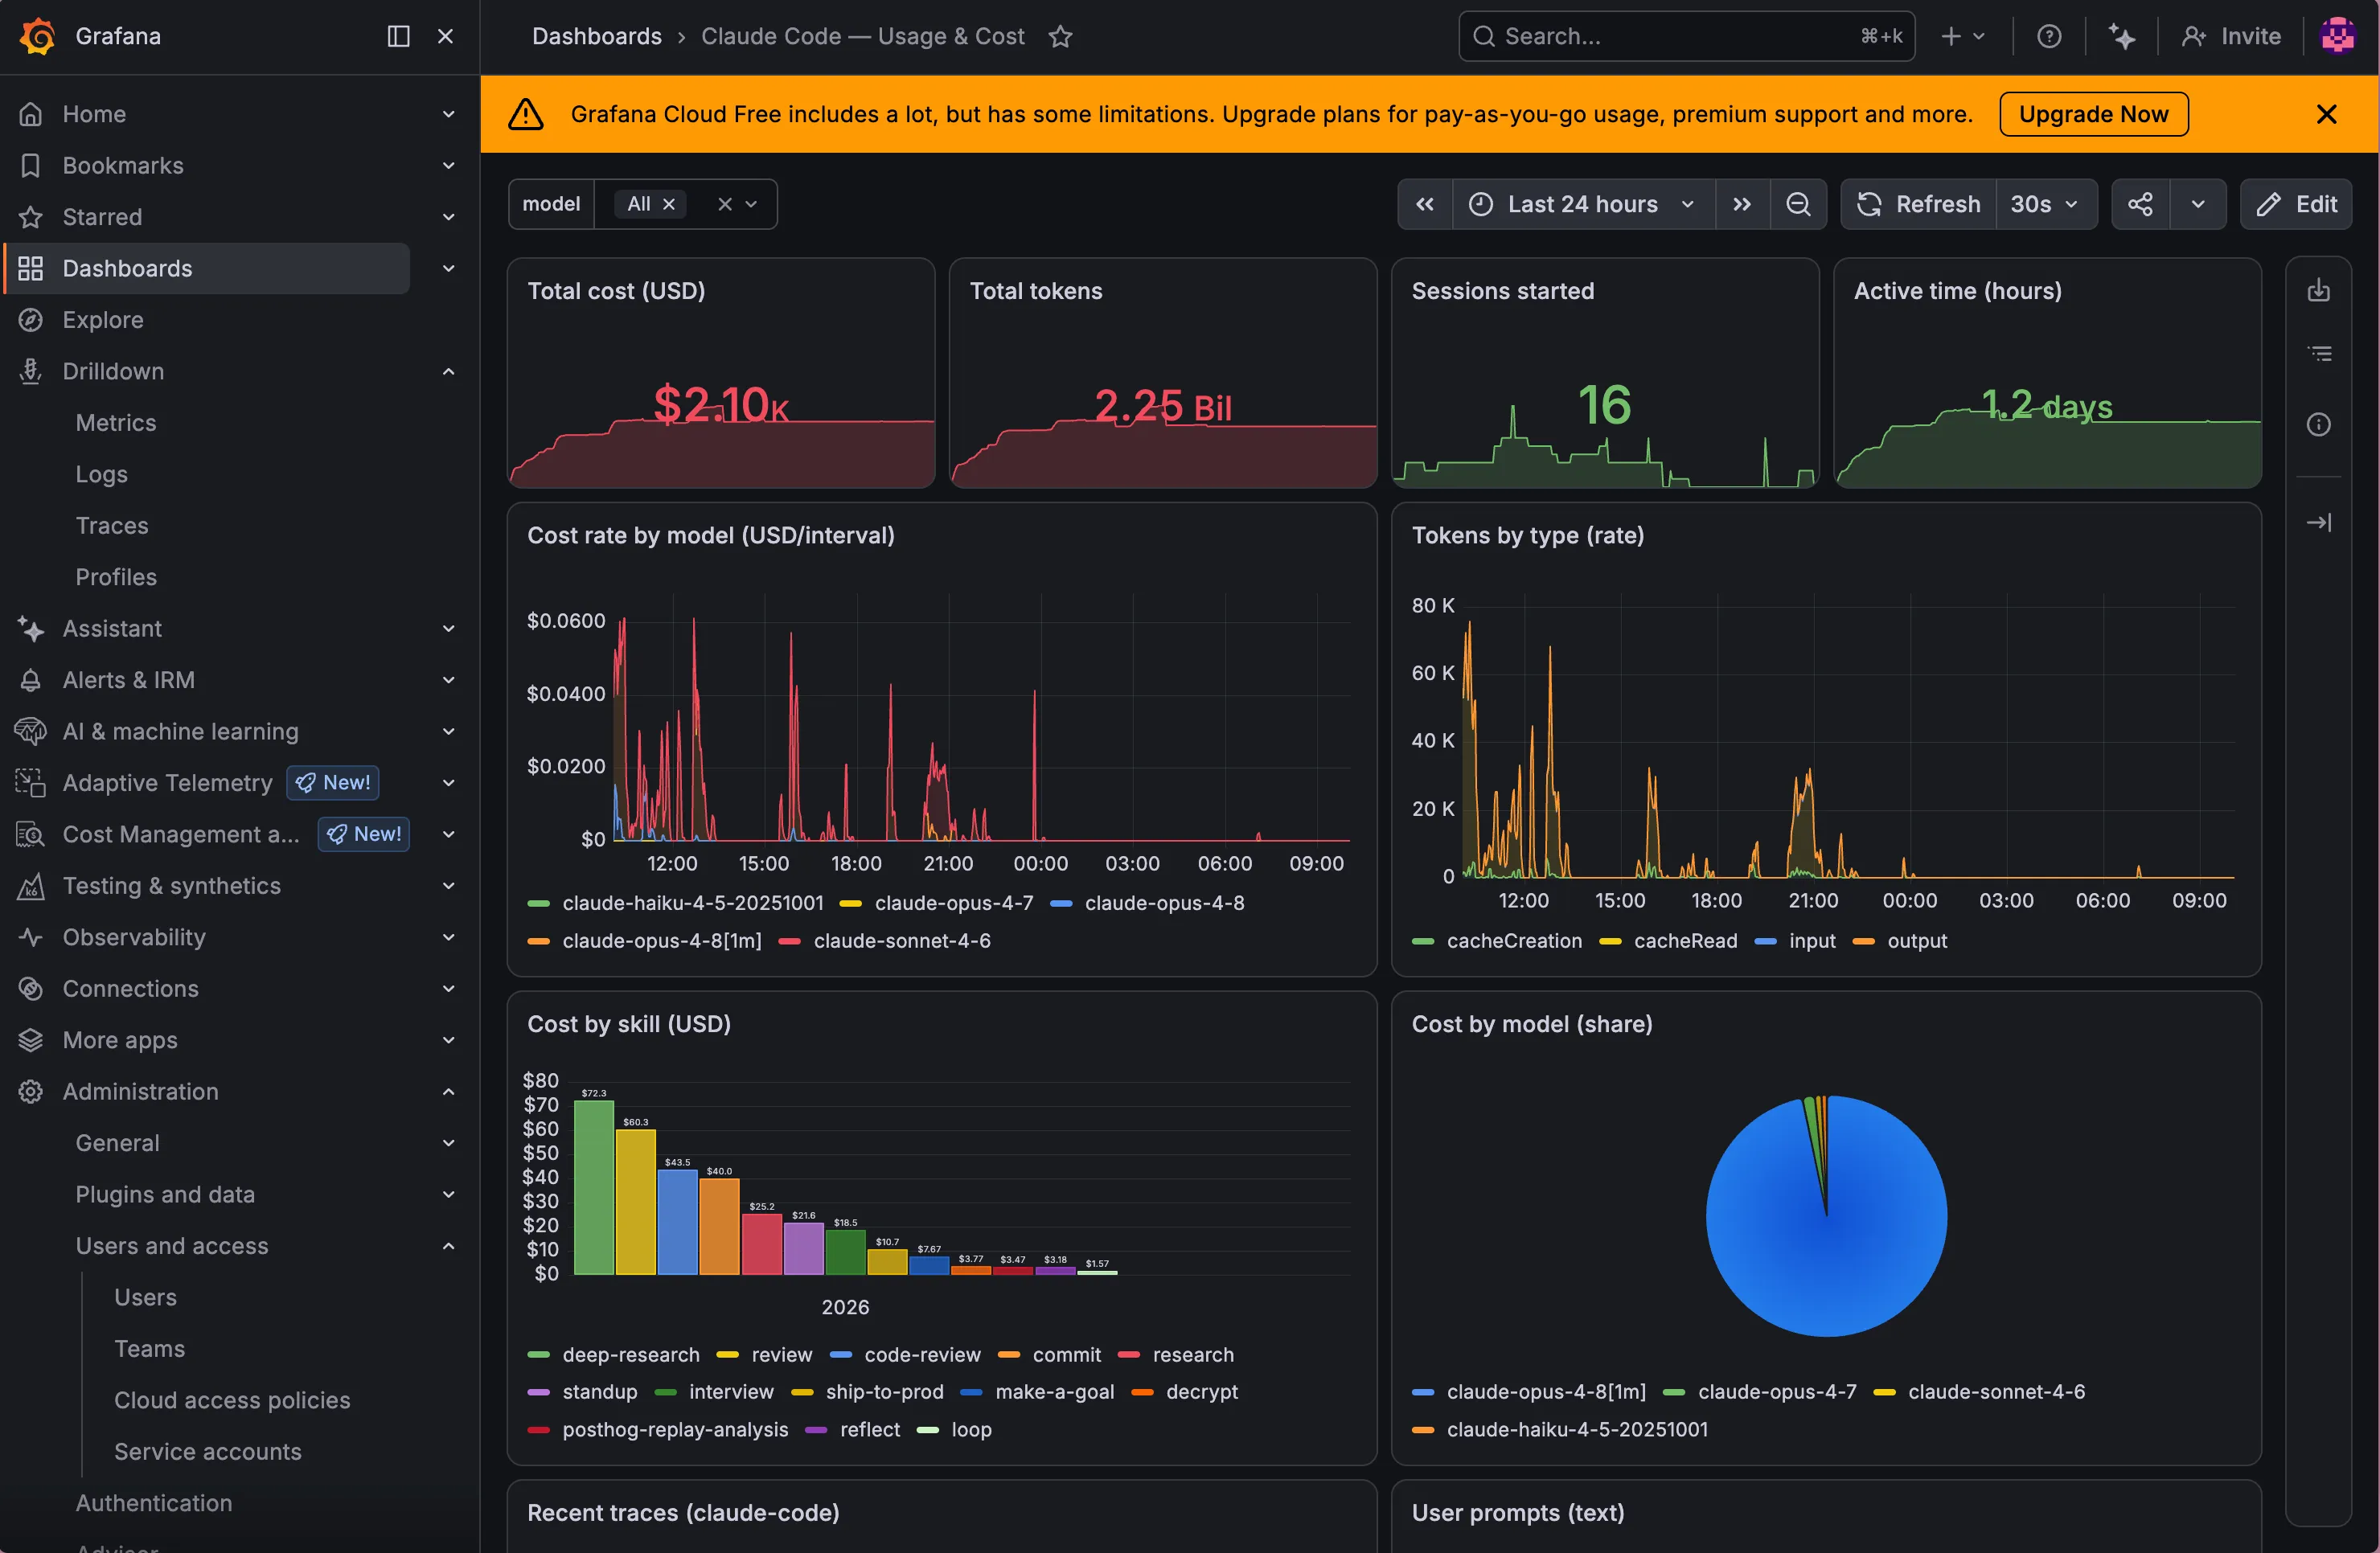
Claude Code: Usage & Cost: total cost/tokens, sessions, active time, cost rate by model, tokens by type, cost by skill, cost-by-model share, plus recent traces and prompt text.
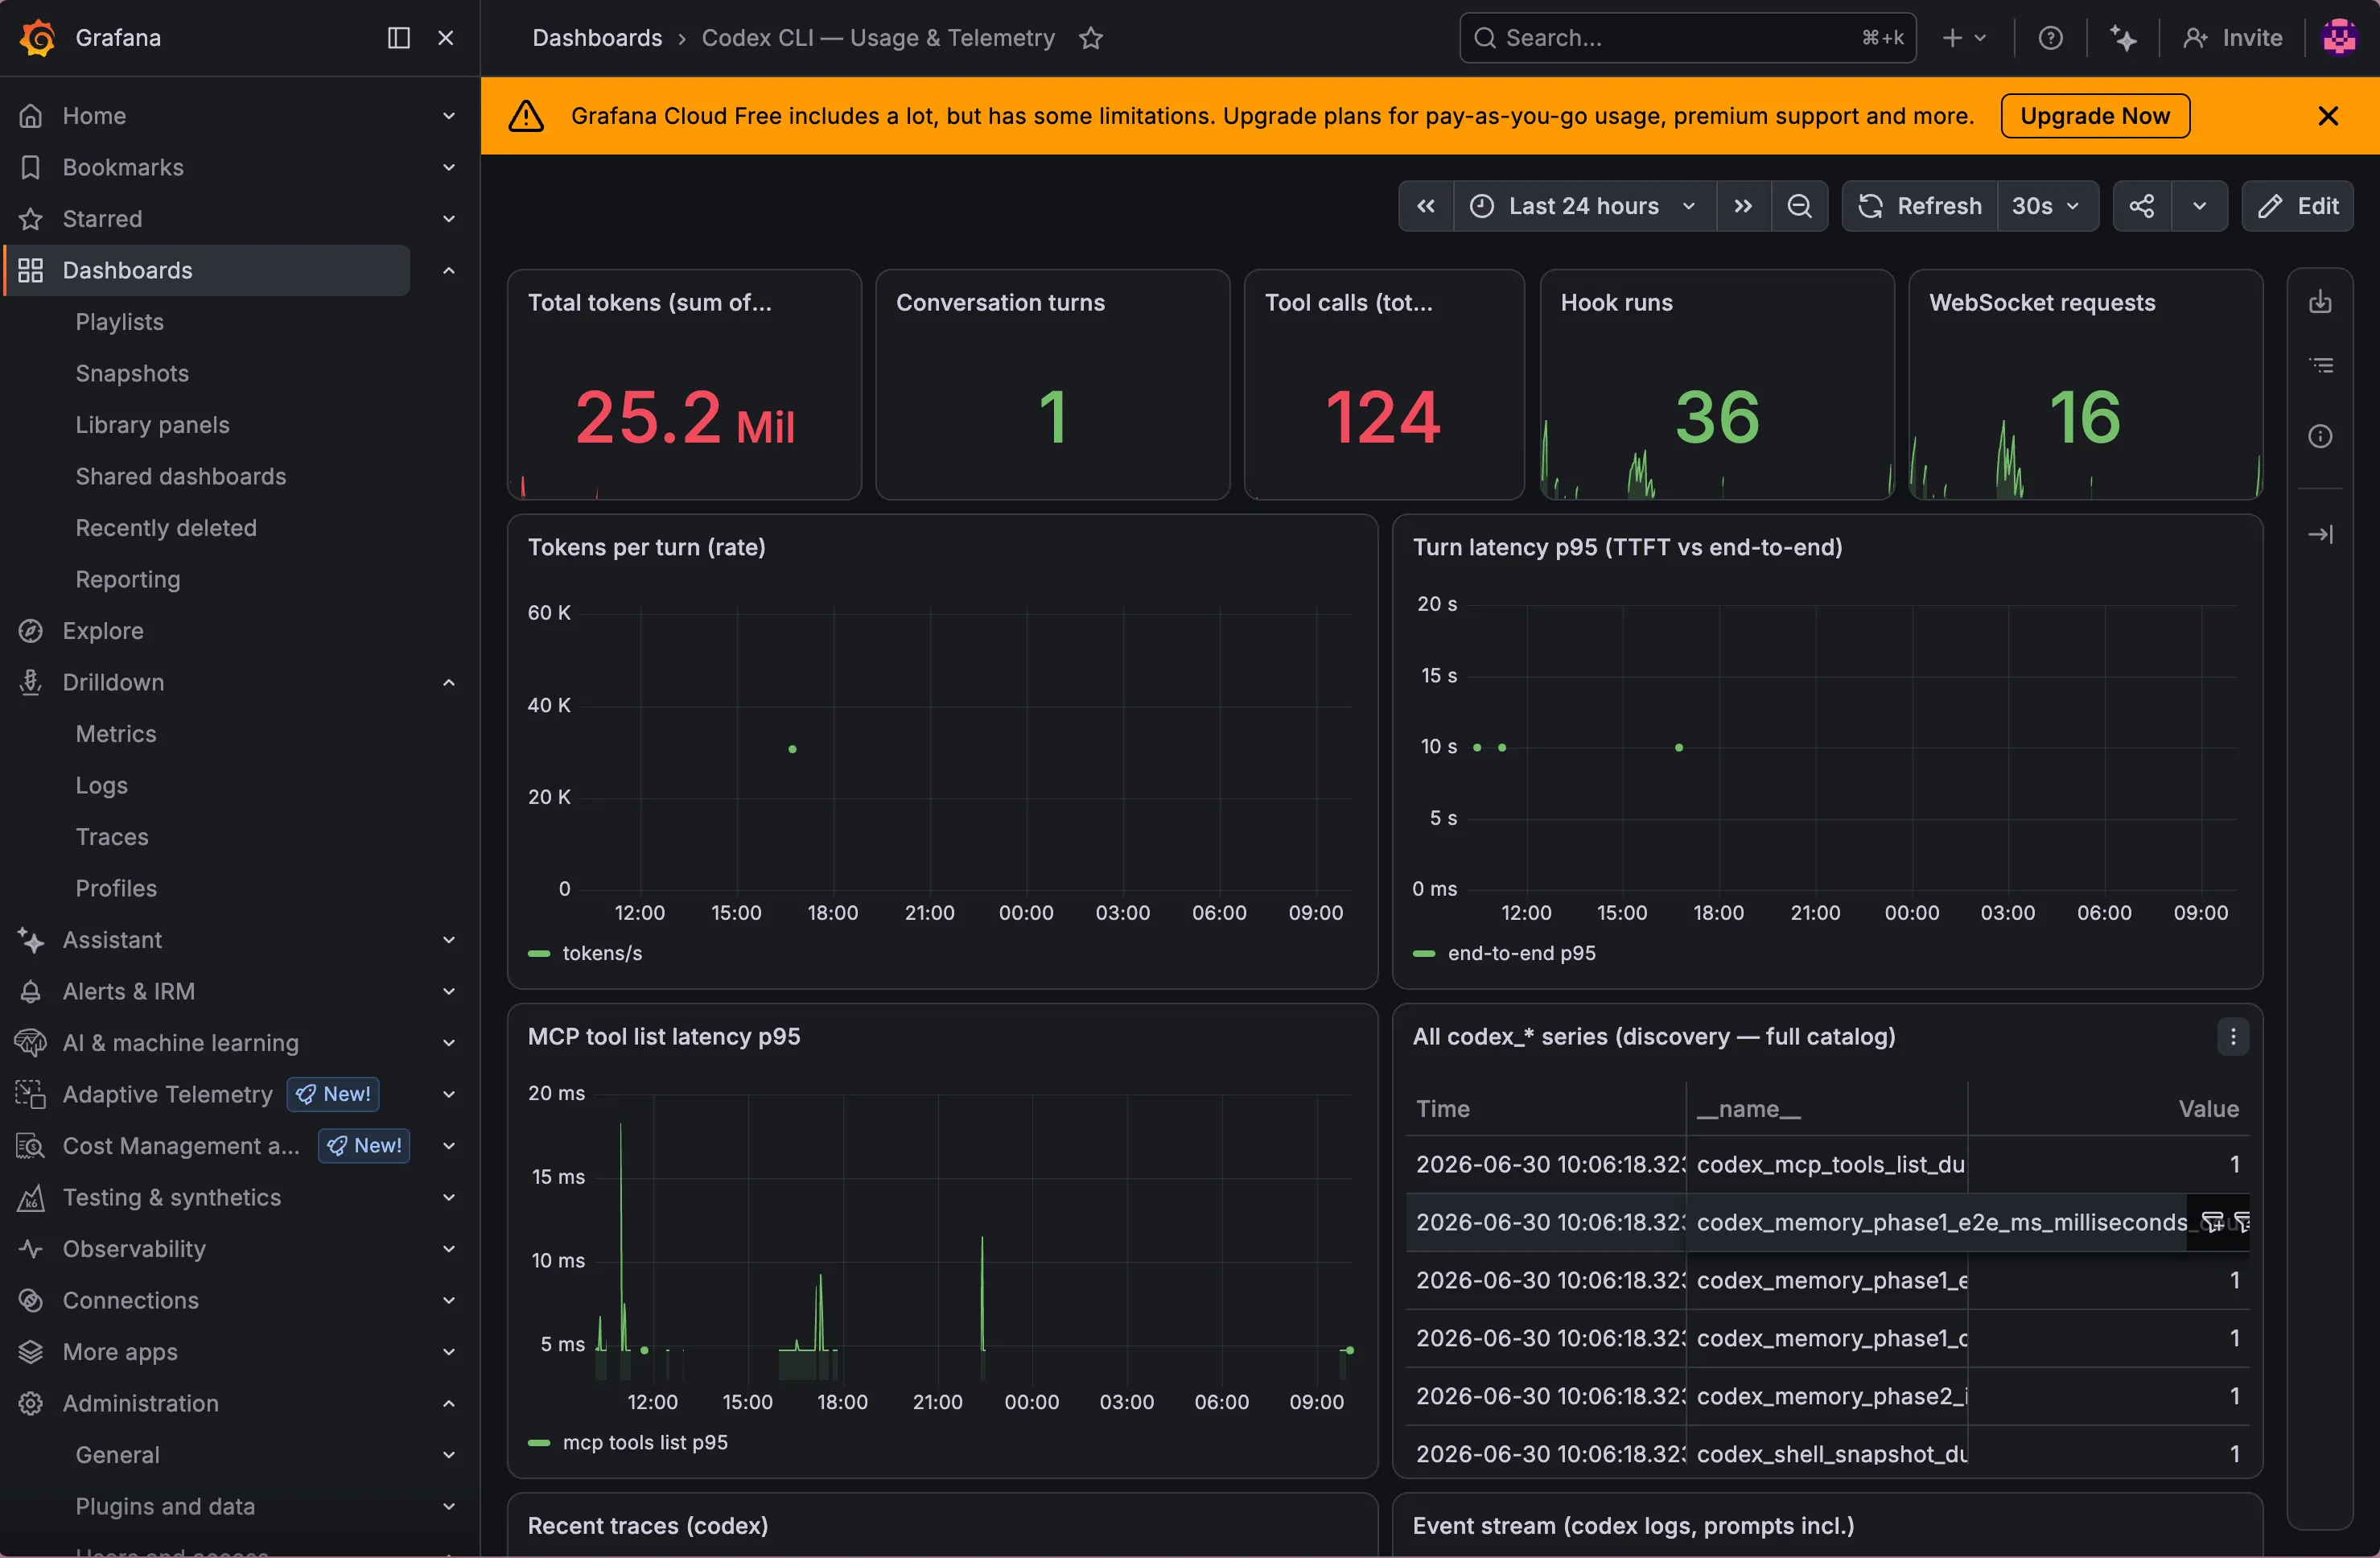
Codex CLI: Usage & Telemetry: total tokens, conversation turns, tool/hook
runs, WebSocket requests, tokens-per-turn and turn-latency p95, MCP tool-list
latency, and the full codex_* series catalog.